Computers, oil and medicines: what sectors drive Tatarstan
Realnoe Vremya has studied what sectors helped the republic’s to grow and what sectors pulled it down and presented the top sectors ranked in industrial production index
2022 predicted a catastrophe for Russia’s industry. However, despite the sanctions and unstable external situation, the country’s industry grew, while Tatarstan managed to keep the positions of one of the most developed industrial regions with its “the country in miniature” economic pattern. Read in a report of Realnoe Vremya’s analytic staff what sectors helped the republican industry to show growth last year and what sectors pulled it down and if Tatarstan can maintain its industrial development pace with falling prices for GRP components.
Tatarstan’s industrial production index in January-November 2022 was 107%. Last year’s data for Russian regions hasn’t yet been presented, but it is already clear that the industry of the republic grew despite the sanctions and tough geopolitical situation. To compare, Moscow’s industrial production index during the same period was 109.1%, that of Saint Petersburg was 104.7%, in the Republic of Bashkortostan — 102.3%.
The Republic of Tuva (134.5%) turned out to be in the top in industrial production growth among the regions of the Russian Federation, Sevastopol (114.1%) and the Nenets Autonomous District (113%). The severest fall in the industry was in Sakhalin (76.4%), Kaliningrad (81.2%) and Kaluga oblasts (82.4%).
Oil production, processing and medicines
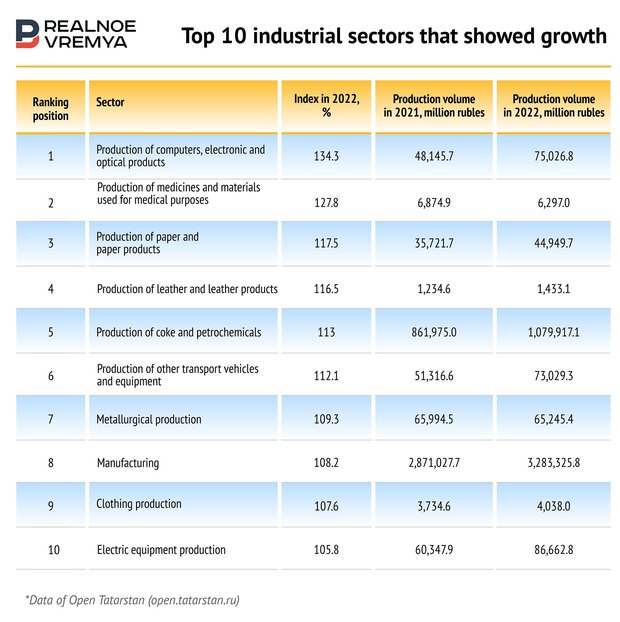
Realnoe Vremya’s analytic staff has studied what sectors helped the Tatarstan industry to grow and what segments pulled it down and made up the top sectors in the industrial production index that showed growth and fall last year.
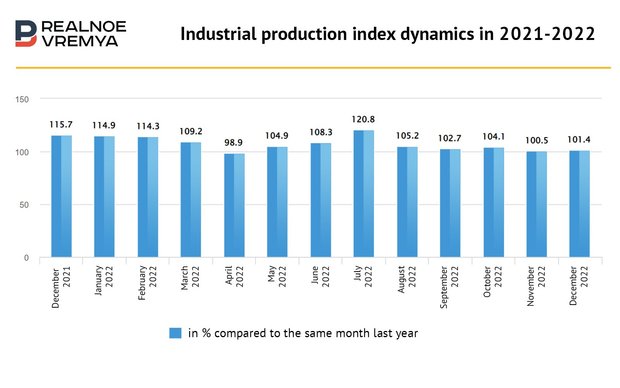
It is noteworthy that Tatarstan’s industrial production index grew unequally in 2022. There was a decline in the industry — for instance, in April, which was the most turbulent for Russia’s economy. A recovery started then. In July, the industrial production index reached 120,8% compared to the same month last year, in September, it dropped to 102.2%. The figures were also low in November, December — 100.5% and 101.4% respectively.
Oil production, oil processing, petrochemistry as well as the sectors where the policy of import substitution played an important role — the production of medicines, computers, paper, clothing and shoes — were at an advantage in 2022.
According to the data from January to December 2022, the production of construction solutions (the index was 180.8%), medicines (133.2%), petrol (140.2%), diesel fuel (126.6%), toilet paper (128.7%), pasta (115.4%), shoes (107.8%), bricks (106.8%), ethylene polymers (106.6%), paper and cardboard (102.1%), oil (103.5%), plastic (102.2%) and electrical energy (103.8%).
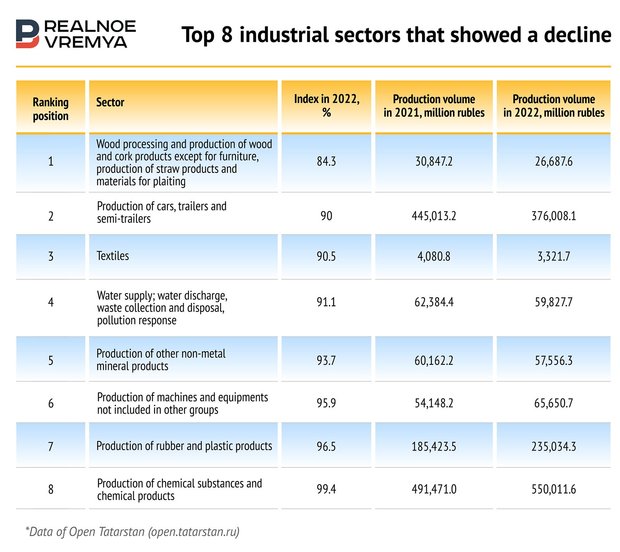
The production of passenger cars (29%), building blocks (64.2%), cargo vehicles (75.7%), construction mixes (78.4%), mazut fuel (81.2%) and household fridges and freezers (91.5%) took the republican industry down.
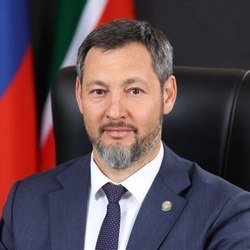
According to the minister, the growth of Tatarstan’s economy is first of all provided by leading sectors — the gas and petrochemical complex, mechanical engineering, energy and construction.
“For instance, the production of computers, electronic and optical products rose by 34.3%. There was growth in other sectors too, particularly the production of clothing increased by 7.6%, furniture did by 1.8%. An aromatics production facility that will open petrochemical projects was launched at TANECO late last year. The new units will allow increasing benzene output by up to 60.000 tonnes a year, master the production of 150.000 tonnes of p-Xylene a year. These products are planned to be used in new plants of Tatneft group,” the vice premier enumerated. “In 2022, KAMAZ produced more than 44,000 lorries. Sollers started the production of lightweight lorries — Atlant from 2.5 to 4.2 tonnes and Argo from 2.5 to 3.5 tonnes. The serial production of Aurus Comendant off-road vehicles began. The Gorky Zelenodolsk Plant delivered seven ships and boats in 2022, including high-speed Meteor that is to update the passenger ship fleet. Russia’s first hydrogen ship started to be manufacturer. These aren’t yet all the successes of our industry that makes a weighty contribution to the development of the non-commodity economy.”
By Oleg Korobchenko’s estimate, there was noted a decline in the production of cars, rubber and plastic products in 2022. But this year the situation is going to be fixed, including thanks to state support measures and the stabilisation of the currency rate, which is comfortable for exporters.
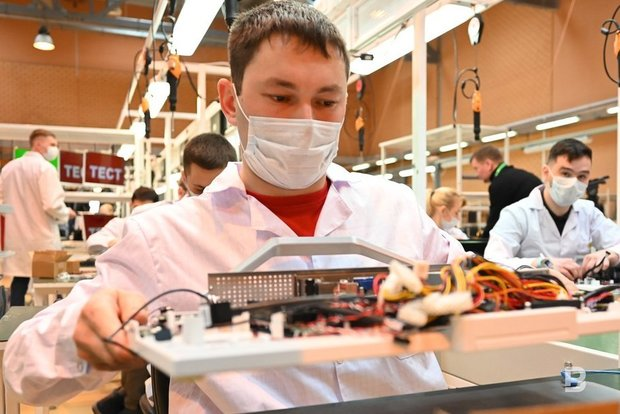
Expert RA rating agency notes that today Tatarstan has a lot of feedstock and is among leading Russian regions in oil production. Tatneft’s Romashkino field is the biggest oil field of the republic and the Volga-Ural province. Mechanical engineering, metal processing, the chemical and petrochemical industry, the light and food industry are leading sectors of the region’s industry.
According to the agency, the industrial production ramped up in manufacturing (+8.3%), mineral production (+5.8%) and electrical energy, gas and steam supply; air conditioning (+1.6%).
Due to the efforts put by businesses and the state support, the investments in working capital in Tatarstan in 2022 increased by 0.5% compared to 2021 in comparable prices — up to 774.4 billion rubles. Five cities of the republic have priority socio-economic development areas. Also, there are two special economic zones Alabuga and Innopolis facilitating the attraction of investments and the implementation of new projects. In 2023, the region expects the investments in working capital to climb to 782.7 billion rubles.
Industry recovery after COVID-19
“Talking about Russia’s industry, as a rule, small sectors grew most in 2022. I call them dummies: they had an absolutely usual story and they are immediately on the rise,” economist and blogger Albert Bikbov explains. “This is why toilet paper isn’t an indicator. Hayat produces paper here in Alabuga, they installed a new machine tool and all of a sudden everything surged. The light industry especially has such a tendency. In 2022, uniforms, balaclava, wool boots started to be produced on a large scale. This provided the light industry with growth in physical terms. Even blanket making now works with three shifts.”

Production decline as general trend
“The industrial production in Russia historically plays an important role in the country’s economy, but its share in GDP constantly shrinks. This happens because of an accelerated rise of economic sectors related to services,” Rustem Shaykhmetov, economic, candidate for economic sciences, head of R-Invest company, commented for Realnoe Vremya. “Now the share of the industrial sector is about 30% of GDP, other economic sectors shape main GDP (some 70%). For a better understanding, the specific weight of trade in Russian GDP is comparable with the share of manufacturing.”
According to forecasts, Russia’s GDP in 2022 will be about 3%. The same applies to industrial production. The Russian Statistics Service says that Russia’s industrial production index in 2022 was 99.4% compared to 2021, while in December 2022 it was 95.7% against December 2021. There was a notable growth in the first half, there were seen tendencies for production decline in the second half of the year.
There are no statistics for the Federation’s regions in 2022 now, but a production decline is a general trend in regional economies, notes Shayakhmetov.

The growth of industrial production in some Russian regions in 2022 is mainly linked to greater production of the defence complex.
According to him, industrial production in Sakhalin, Kaliningrad and Kaluga oblasts decreased because of the sanctions because Western investment projects, particularly in car manufacturing and the oil and gas sector, were implemented in these regions.
The price growth and the existing uncertainty in the economy shaped moderate purchasing activity and led to a refusal of many projects, first of all, long-term ones. In 2022, the price index of producers of industrial products was 111.4% compared to the last year. Domestic demand decreased, and in the external market export possibilities of Russian products and services were weakened by the sanctions, the expert concluded.
Also, on 5 February, the embargo on Russian petrochemicals by sea came into force and the price cap on their shipping to third countries was fixed. For oil products that are traded as bonus pay for oil (petrol and petrol mixes, gas oil, diesel fuel and jet fuel), the price cap was $100 per barrel, while for those sold at a discount (naphtha, different mazut and oils as well as used petrochemicals), it is $45 per barrel. Companies and natural persons from the countries in the so-called Price Cap Coalition are forbidden from providing technical, financial and brokerage services to transport Russian petrochemicals to third countries for a price above the fixed cap. The restrictions can lead to lower exports of Russian petrochemicals in 2023.
|
Ranking position |
Sector |
Index in 2022, % |
Production volume in 2021, million rubles |
Production volume in 2022, million rubles |
|
1 |
Production of computers, electronic and optical products |
134.3 |
48,145.7 |
75,026.8 |
|
2 |
Production of medicines and materials used for medical purposes |
127.8 |
6,874.9 |
6,297.0 |
|
3 |
Production of paper and paper products |
117.5 |
35,721.7 |
44,949.7 |
|
4 |
Production of leather and leather products |
116.5 |
1,234.6 |
1,433.1 |
|
5 |
Production of coke and petrochemicals |
113 |
861,975.0 |
1,079 917.1 |
|
6 |
Production of other transport vehicles and equipment |
112.1 |
51 316.6 |
73,029.3 |
|
7 |
Metallurgical production |
109.3 |
65 994.5 |
65,245.4 |
|
8 |
Manufacturing |
108.2 |
2,871,027.7 |
3,283,325.8 |
|
9 |
Clothing production |
107.6 |
3,734.6 |
4,038,0 |
|
10 |
Production of electric equipment |
105.8 |
60 347.9 |
86,662.8 |
|
11 |
Production of beverages |
105.3 |
26,924.6 |
35,711.9 |
|
12 |
Mineral production |
105.2 |
101,286,055.4 |
1,028,548.2 |
|
13 |
Food production |
103.8 |
259,450.9 |
292,292.3 |
|
14 |
Production of finished metal products except for machines and equipment |
102.4 |
110.069.2 |
103,699.5 |
|
15 |
Furniture production |
101.8 |
5,797.7 |
3,582.2 |
|
16 |
Production of other finished products |
100.2 |
9,546.3 |
19,948.6 |
|
17 |
Electrical energy, gas and steam supply; air conditioning |
100 |
9,546.3 |
166,395.1 |
|
18 |
Production of chemical substances and chemical products |
99.4 |
491,471.0 |
550,011.6 |
|
19 |
Production of rubber and plastic products |
96.5 |
185,423.5 |
235,034.3 |
|
20 |
Production of machines and equipment not included in other groups |
95.9 |
54,148.2 |
65,650.7 |
|
21 |
Production of other non-metal mineral products |
93.7 |
60,162.2 |
57,556.3 |
|
22 |
Water supply; water discharge, waste collection and disposal, pollution response |
91.1 |
62,384.4 |
59,827.7 |
|
23 |
Textiles |
90.5 |
4,080.8 |
3,321.7 |
|
24 |
Production of cars, trailers and semi-trailers |
90 |
445,013.2 |
376,008.1 |
|
25 |
Wood processing and production of wood and cork products except for furniture, production of straw products and materials for plaiting |
84.3 |
30,847.2 |
26,687.6 |